curve_line is a drawable whose path connects an arbitrary number of
control points (x, y) with straight segments, in order. With two control
points this is a single line segment; with more, an open polyline.
curve_lines() is a vectorized version of curve_line(). Since
x/y are themselves numeric vectors of control points for a single
polyline, curve_lines() takes them as a list() of numeric vectors
instead – one vector of control points per polyline.
Usage
curve_line(x, y, trans = trans_identity(), ...)

curve_lines(x, y, trans = trans_identity(), ...)
Arguments
- x, y
For
curve_line(), numeric vectors of control point coordinates, the same length, with at least two control points. Forcurve_lines(), alist()of such vectors instead – one vector of control points per polyline.- trans
A trans object applied to the curve's computed points. Default
trans_identity()(no transform).- ...
Arguments passed to
style().
Details
Unlike curve_bezier()/shape_bezier(), the control points are not
smoothed or resampled – points is exactly (x, y), so there is no
n argument.
style@fill has no effect for curve_line() – see drawable's
geometry documentation for why "path" geometries have no interior to
fill. Passing fill via ... is still accepted (it's simply ignored at
draw time), since style() is shared across every geometry.
Every other argument may be a plain vector, recycled against x/y
via purrr::pmap()'s own vctrs-based rules (any length-1 element is
broadcast to the common length; mismatched lengths greater than 1
raise an error). The result is a sketch containing one
curve_line() per list element/recycled row, rather than a single
drawable.
See also
Other 1D curves:
curve_arc(),
curve_bezier(),
curve_raw(),
curve_scribble(),
curve_spiral(),
curve_twist()
Examples
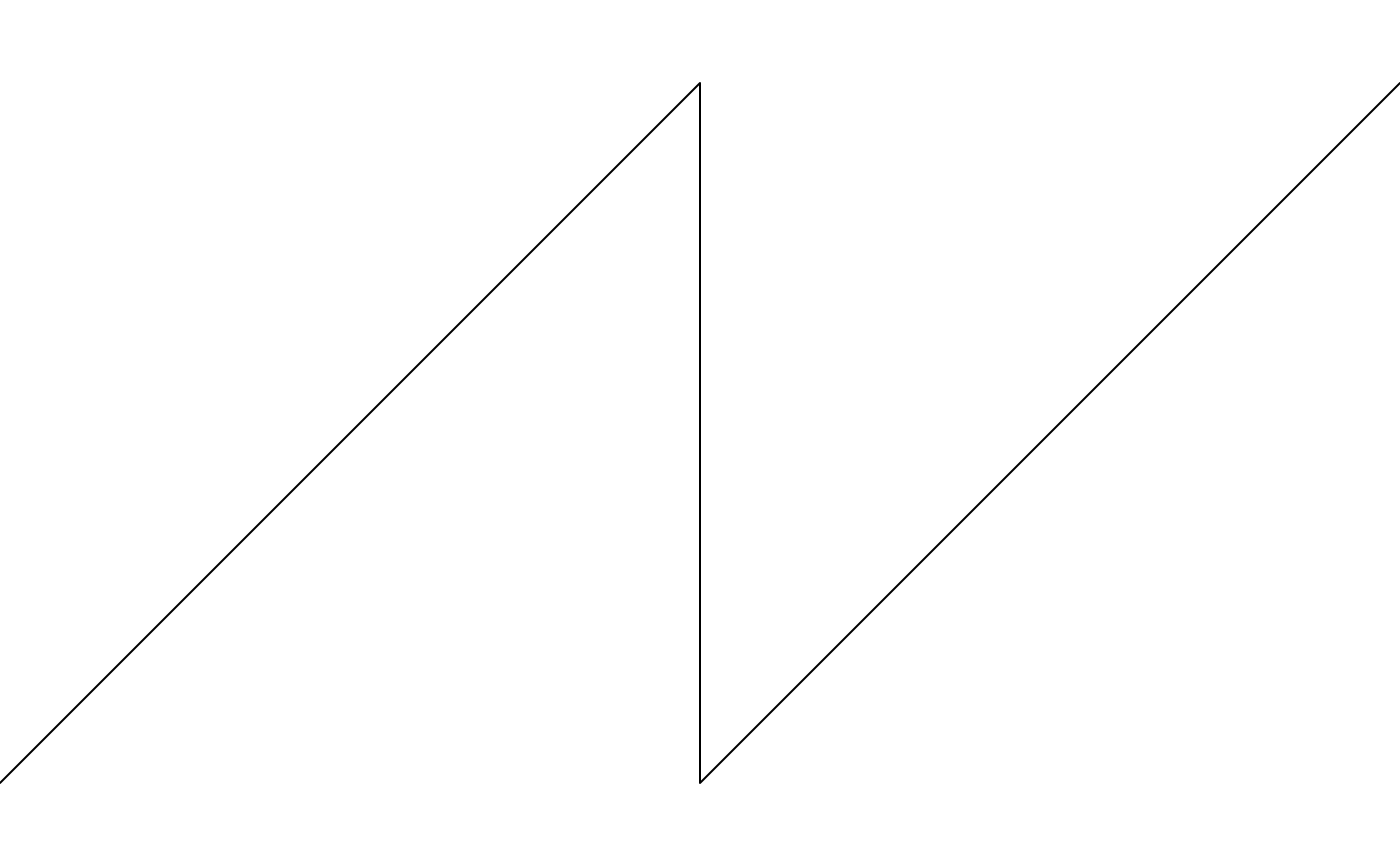
draw(curve_line(x = c(0, 1, 1, 2), y = c(0, 1, 0, 1)))
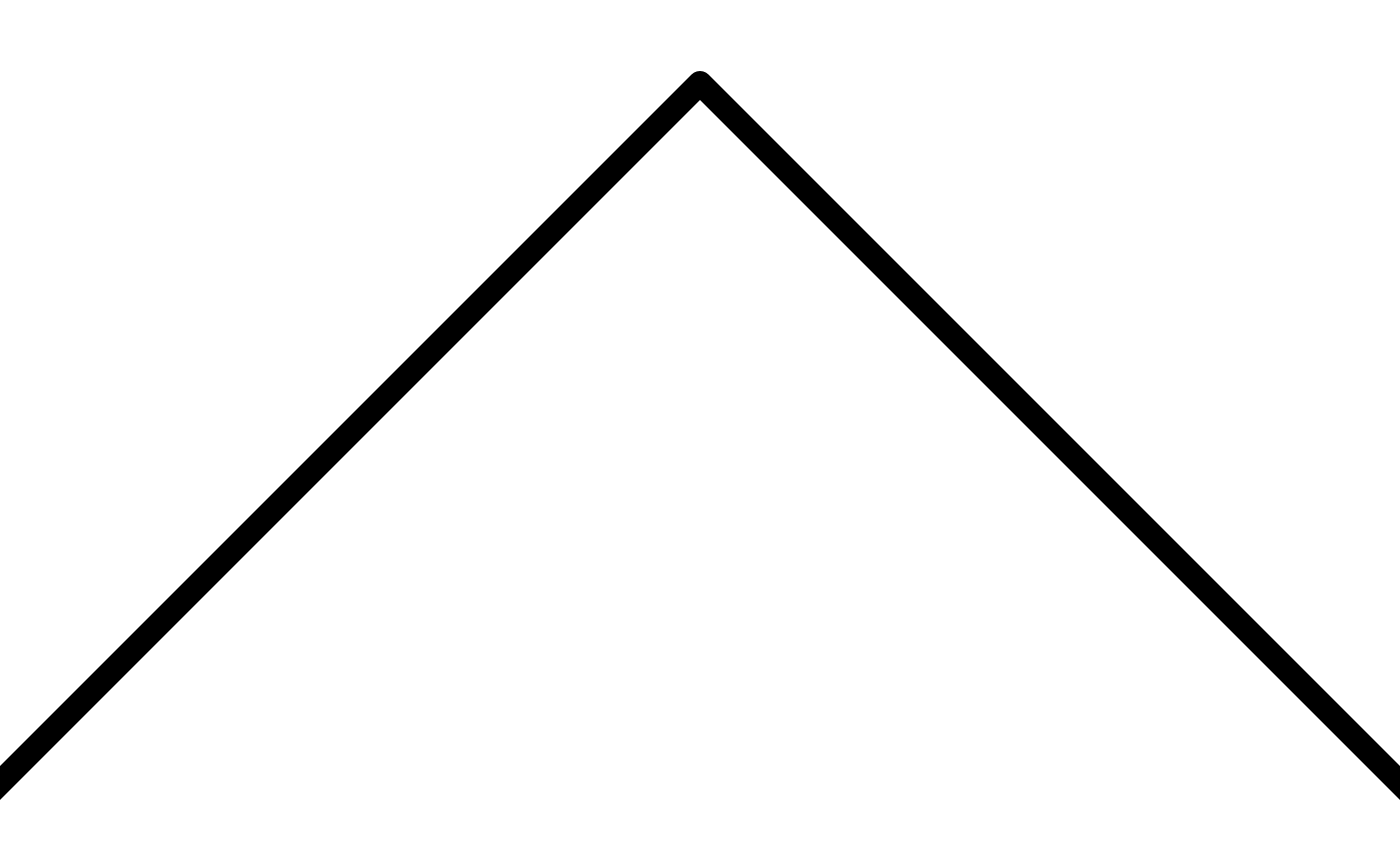
 # a thick, square-capped line reads very differently from a thin,
# round-capped one
draw(curve_line(
x = c(0, 1, 2), y = c(0, 1, 0), linewidth = 12, lineend = "square"
))
# a thick, square-capped line reads very differently from a thin,
# round-capped one
draw(curve_line(
x = c(0, 1, 2), y = c(0, 1, 0), linewidth = 12, lineend = "square"
))
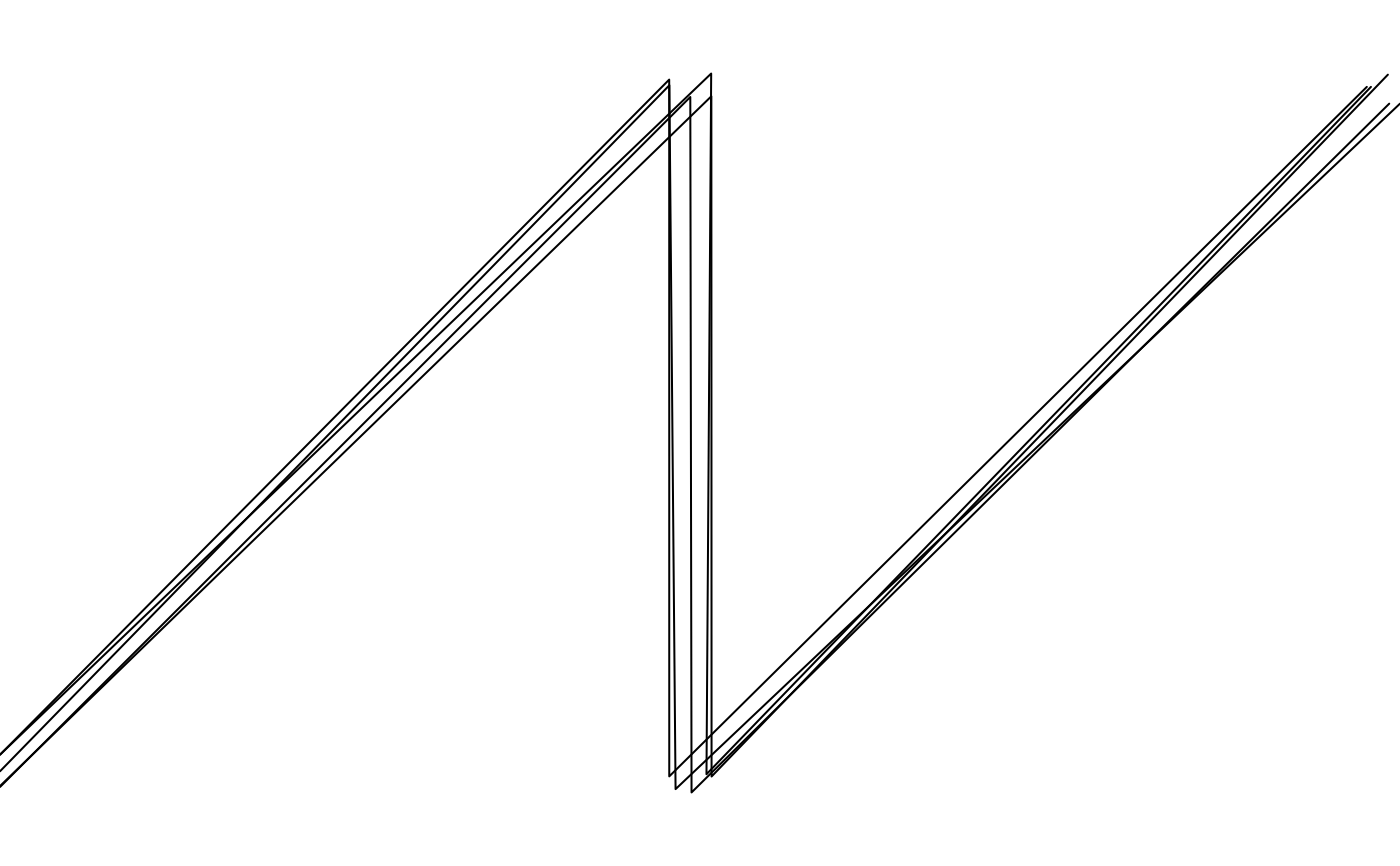
 # layer several jittered copies for a hand-drawn look
draw(effect_tremor(
curve_line(x = c(0, 1, 1, 2), y = c(0, 1, 0, 1)),
layers = 5L
))
# layer several jittered copies for a hand-drawn look
draw(effect_tremor(
curve_line(x = c(0, 1, 1, 2), y = c(0, 1, 0, 1)),
layers = 5L
))
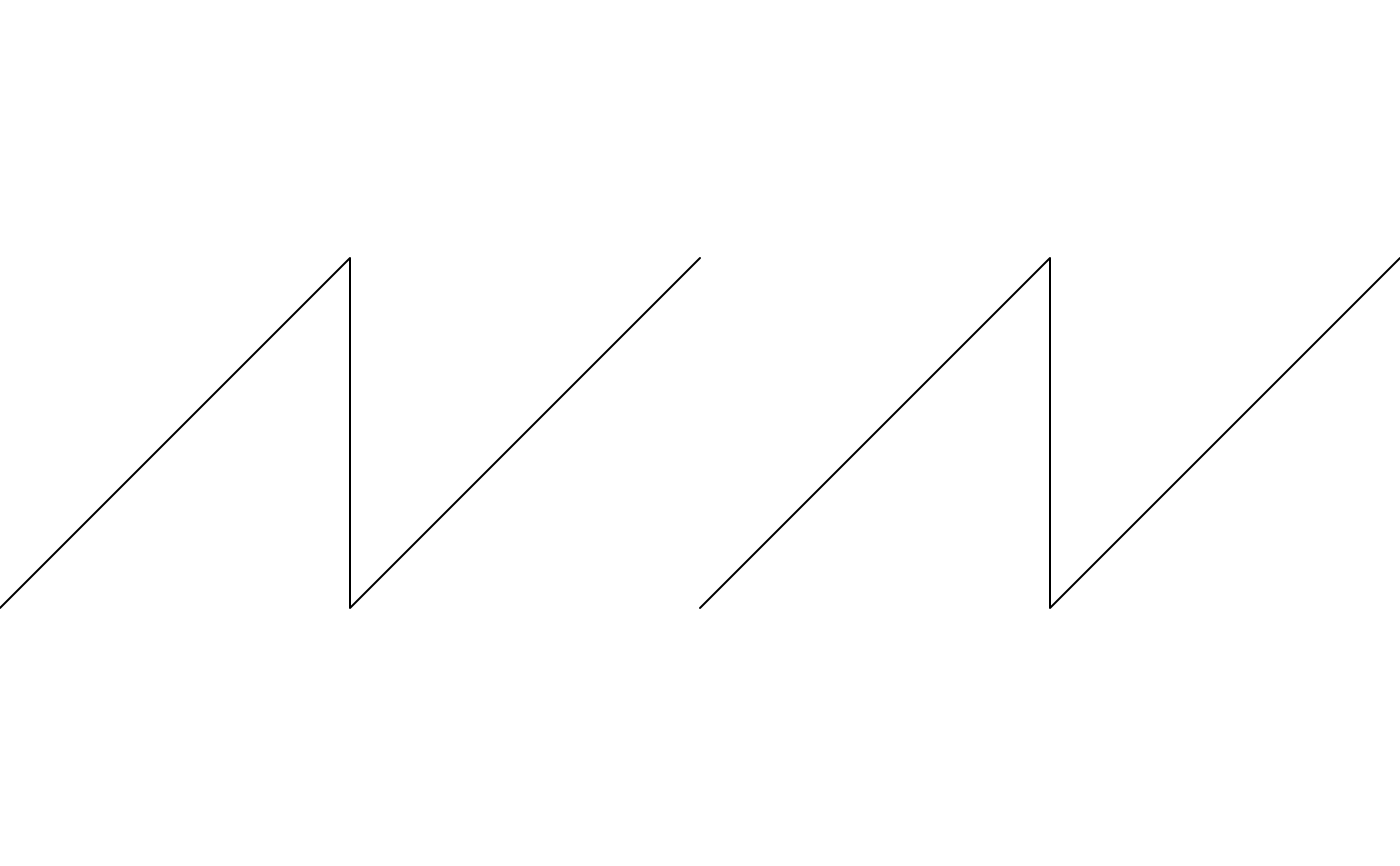
 draw(curve_lines(
x = list(c(0, 1, 1, 2), c(2, 3, 3, 4)),
y = list(c(0, 1, 0, 1), c(0, 1, 0, 1))
))
draw(curve_lines(
x = list(c(0, 1, 1, 2), c(2, 3, 3, 4)),
y = list(c(0, 1, 0, 1), c(0, 1, 0, 1))
))
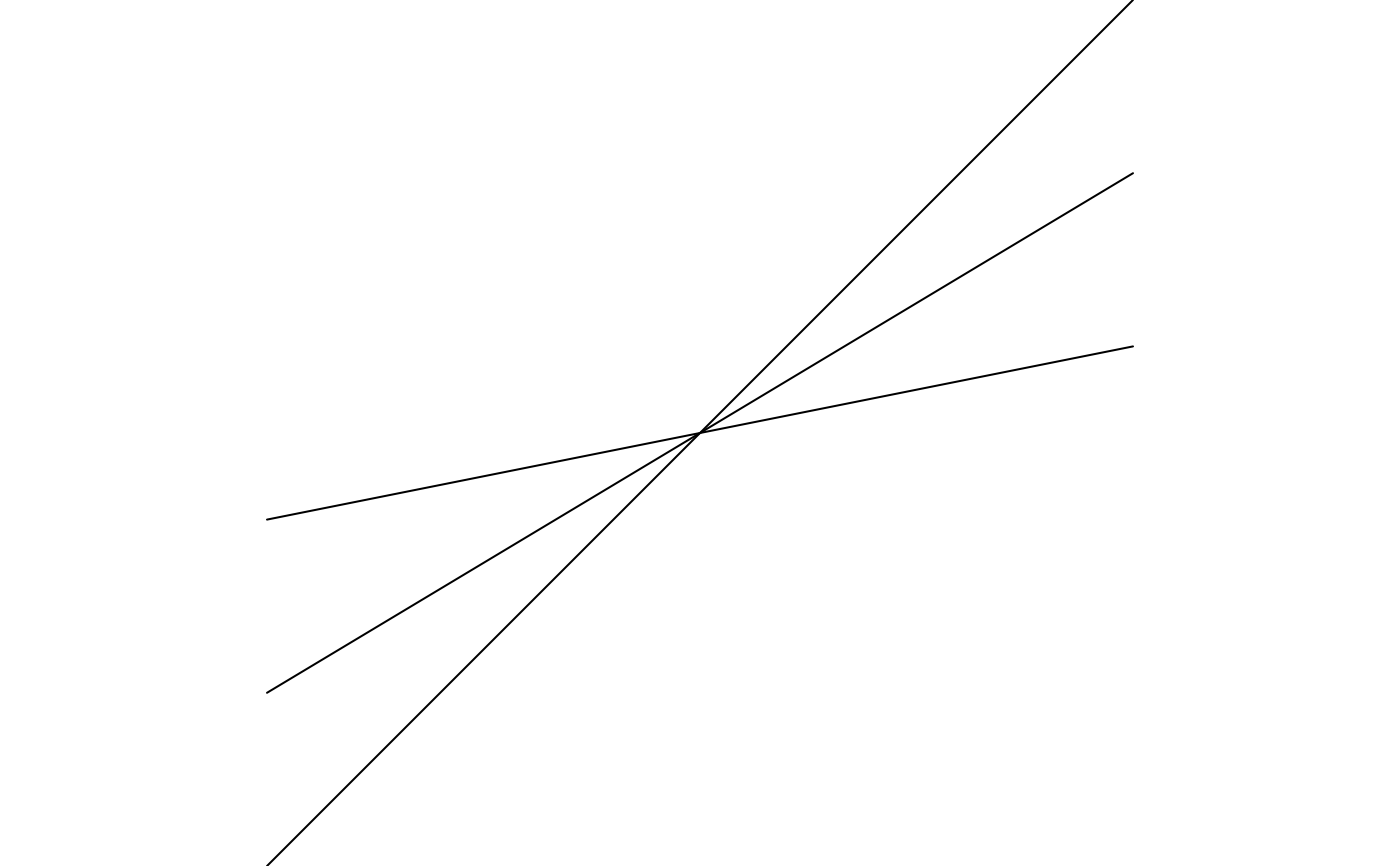
 # a simple hatched grid of crossing lines
draw(curve_lines(
x = list(c(0, 5), c(0, 5), c(0, 5)),
y = list(c(0, 5), c(1, 4), c(2, 3))
))
# a simple hatched grid of crossing lines
draw(curve_lines(
x = list(c(0, 5), c(0, 5), c(0, 5)),
y = list(c(0, 5), c(1, 4), c(2, 3))
))